
In the context of the energy transition and sustainable development, it is crucial to have tools that integrate multiple sources of georeferenced data to support strategic decision-making. This analysis aligns with Spain’s commitments to sustainability, climate neutrality, and ecological transition. In line with the 2030 Agenda and the goals of the National Integrated Energy and Climate Plan (PNIEC), the expansion of renewable energy is presented as a strategic priority, not only to reduce emissions but also to transform territorial models.
Thanks to its geographical location and climatic conditions, Spain has a high potential for the development of renewable energy. However, its deployment requires integrated spatial planning that minimizes environmental and social impacts, leverages existing infrastructure, and adapts to the technical constraints of each energy source.
We use a spatial management system based on PostgreSQL/PostGIS, with visualization in QGIS, which enables the integration and analysis of large volumes of georeferenced information. The main objective is to identify optimal areas for the development of various renewable energy sources in the Iberian Peninsula, considering both socio-environmental and technical-operational criteria.
The aim is to contribute to strategic territorial planning that facilitates the expansion of renewables while minimizing conflicts with the natural and human environment, optimizing connections to existing infrastructure, and considering the specific conditions required for each energy type to be used efficiently. The energies analyzed include wind, solar photovoltaic, hydroelectric, and renewable thermal energy (biomass and geothermal). Nuclear energy is explicitly excluded, as it does not align with the principles of sustainability, low environmental impact, and energy decentralization that guide this study.
Renewable energy planning must consider multiple factors beyond the mere availability of natural resources. It is essential to identify areas where implementation will not cause social tensions, interfere with high-value protected natural spaces, and be located near infrastructure that facilitates integration into the electrical or thermal grid. Technically, each source has specific requirements: solar requires high irradiation; wind requires sustained wind speeds; hydro requires slopes and watercourses; and thermal energy needs stable heat demand, generally associated with higher population densities. This combination of variables calls for a spatial analysis approach tailored to each energy type.
Wind Energy
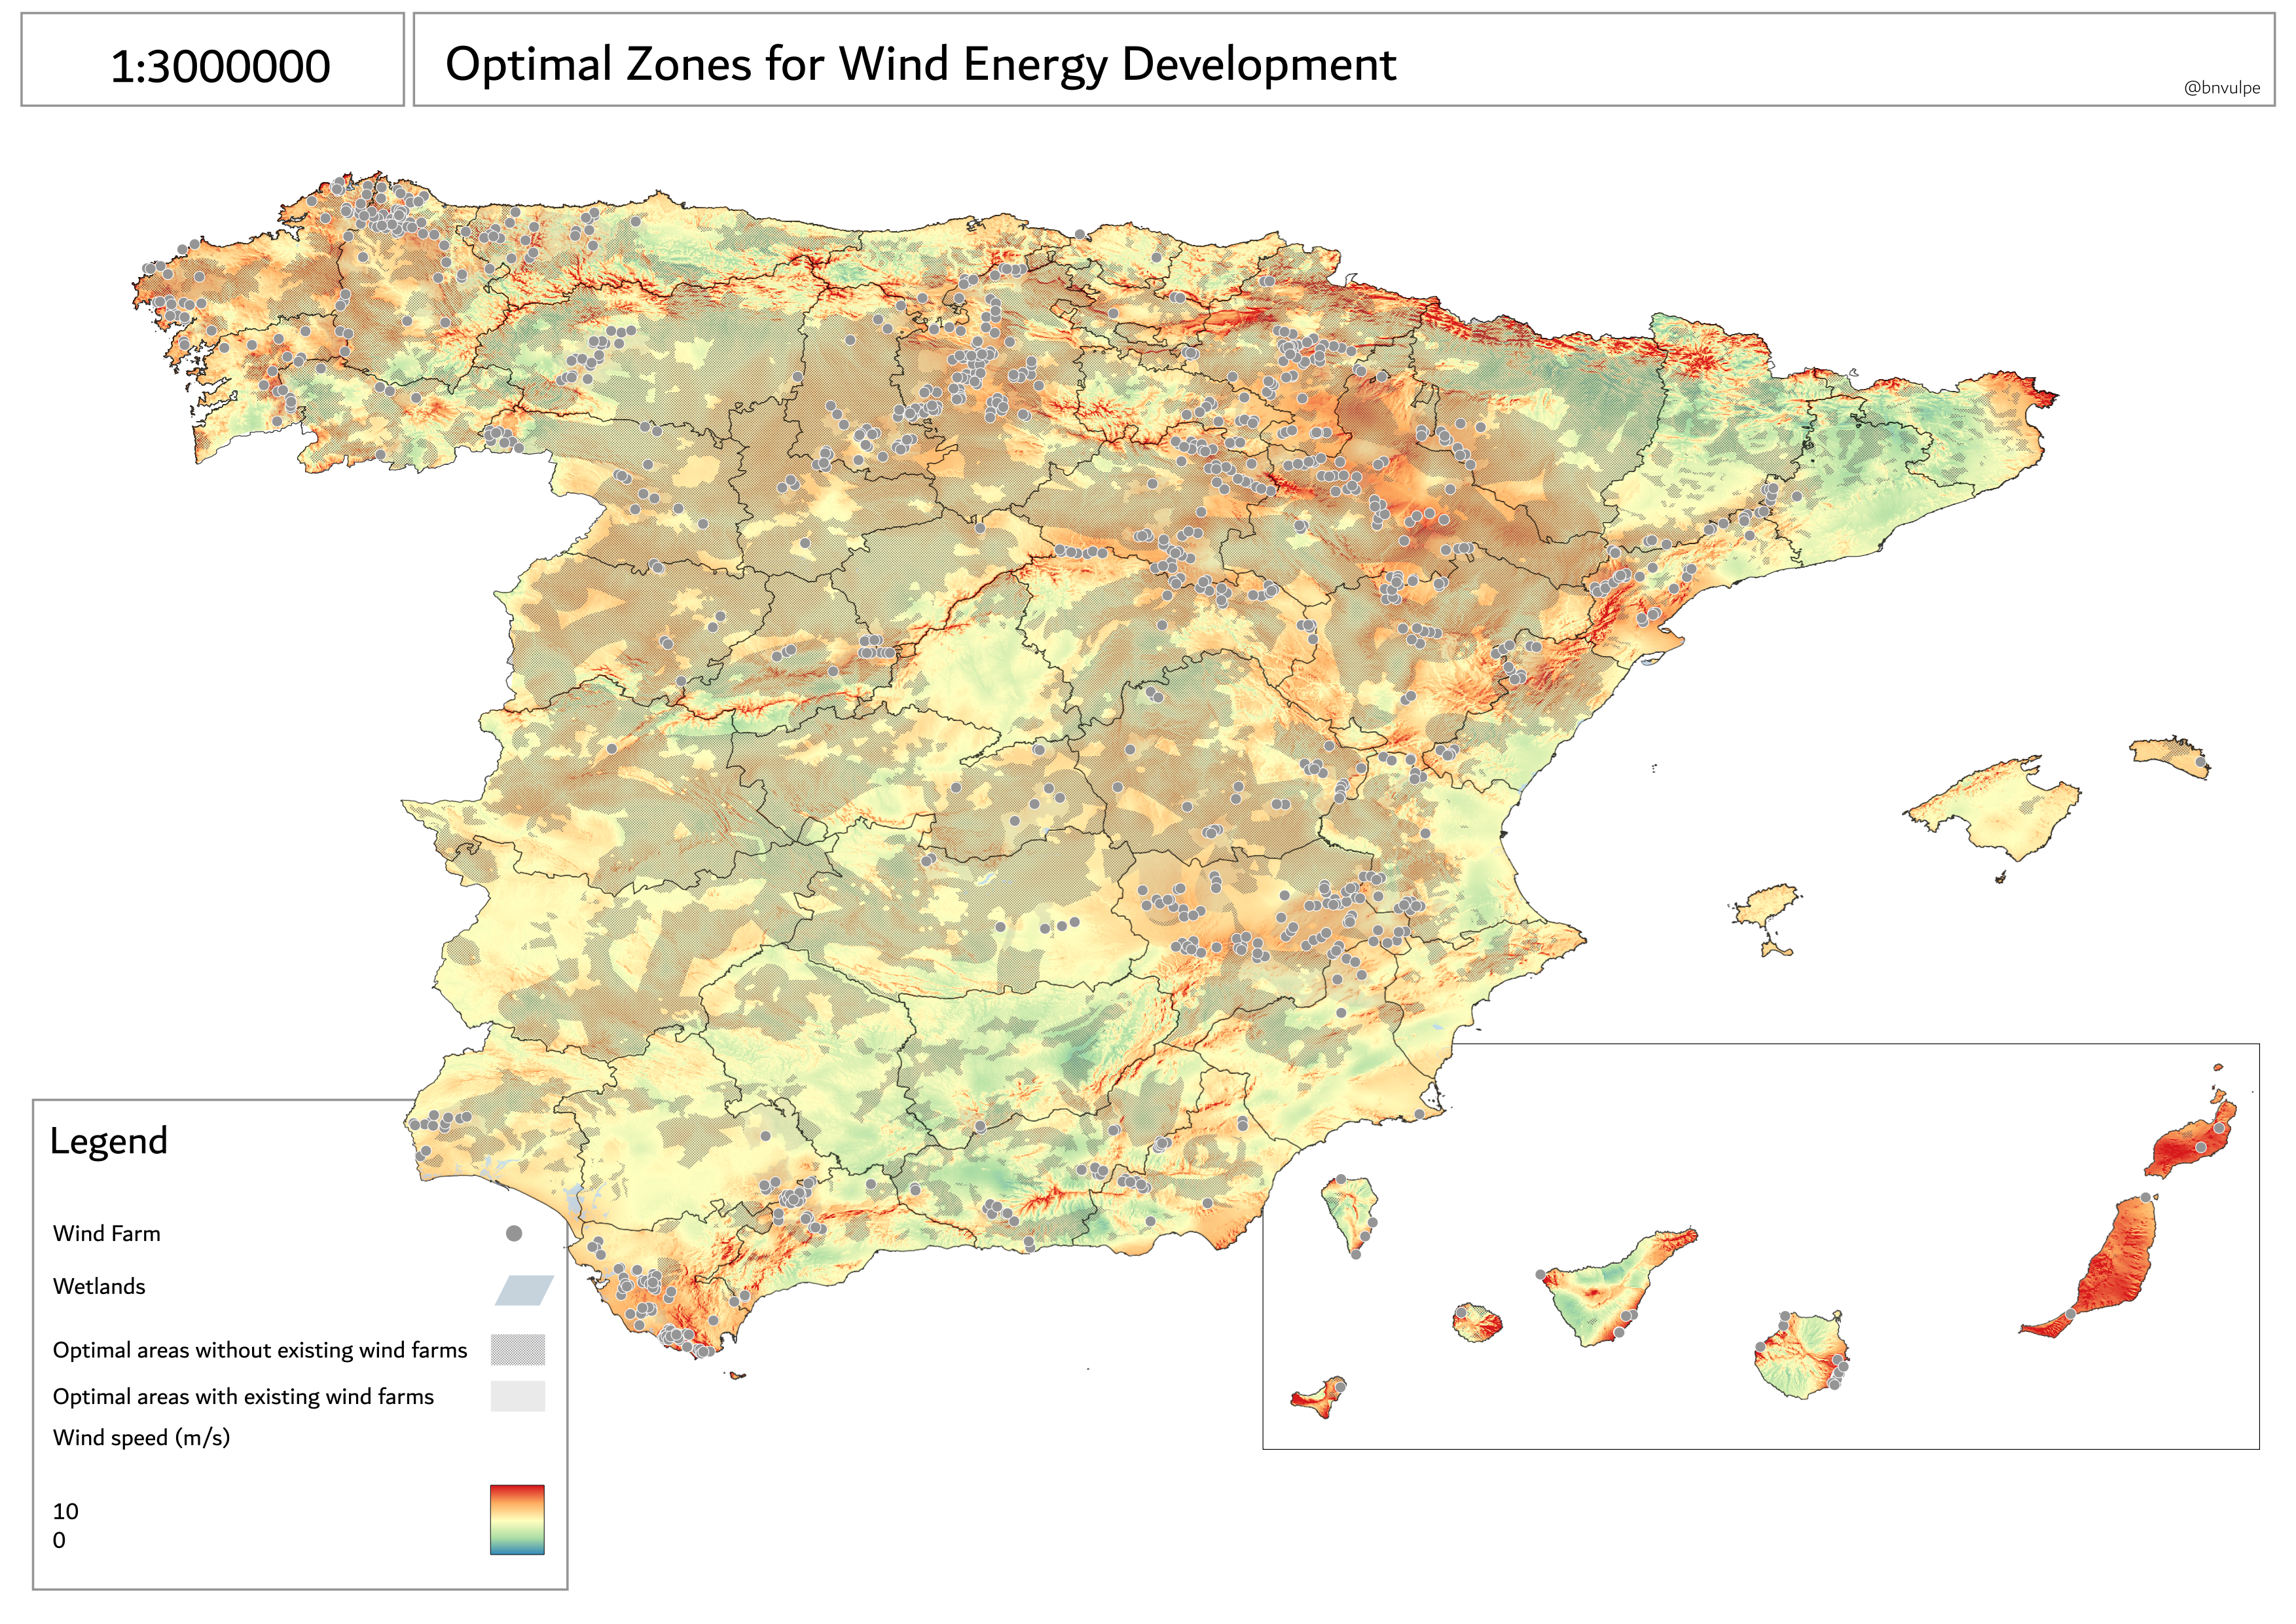
This national-scale map shows the areas considered optimal for wind energy development in Spain. It visually distinguishes areas with existing wind farms from those yet to be exploited, allowing the identification of regions with high development potential. A wetlands layer and a raster background representing average wind speed are also included. By analyzing the intersection between optimal zones and areas with medium-high wind speeds, it is possible to locate the provinces with the greatest wind energy potential.
The most promising areas without nearby wind farms are located in eastern A Coruña, northern León, northeastern Cantabria, western Álava, northern Huesca, northeastern Girona, eastern Zaragoza, central and northern Castellón, northern Madrid, central-northern Alicante, central-western Murcia, central-northern Almería, southern Badajoz, central-western Cáceres, and western Toledo. Due to the high concentration of wind infrastructure in some provinces, especially strategic zones are found within Madrid, Cáceres, Badajoz, Girona, Huesca, and Toledo.
Thermal Energy
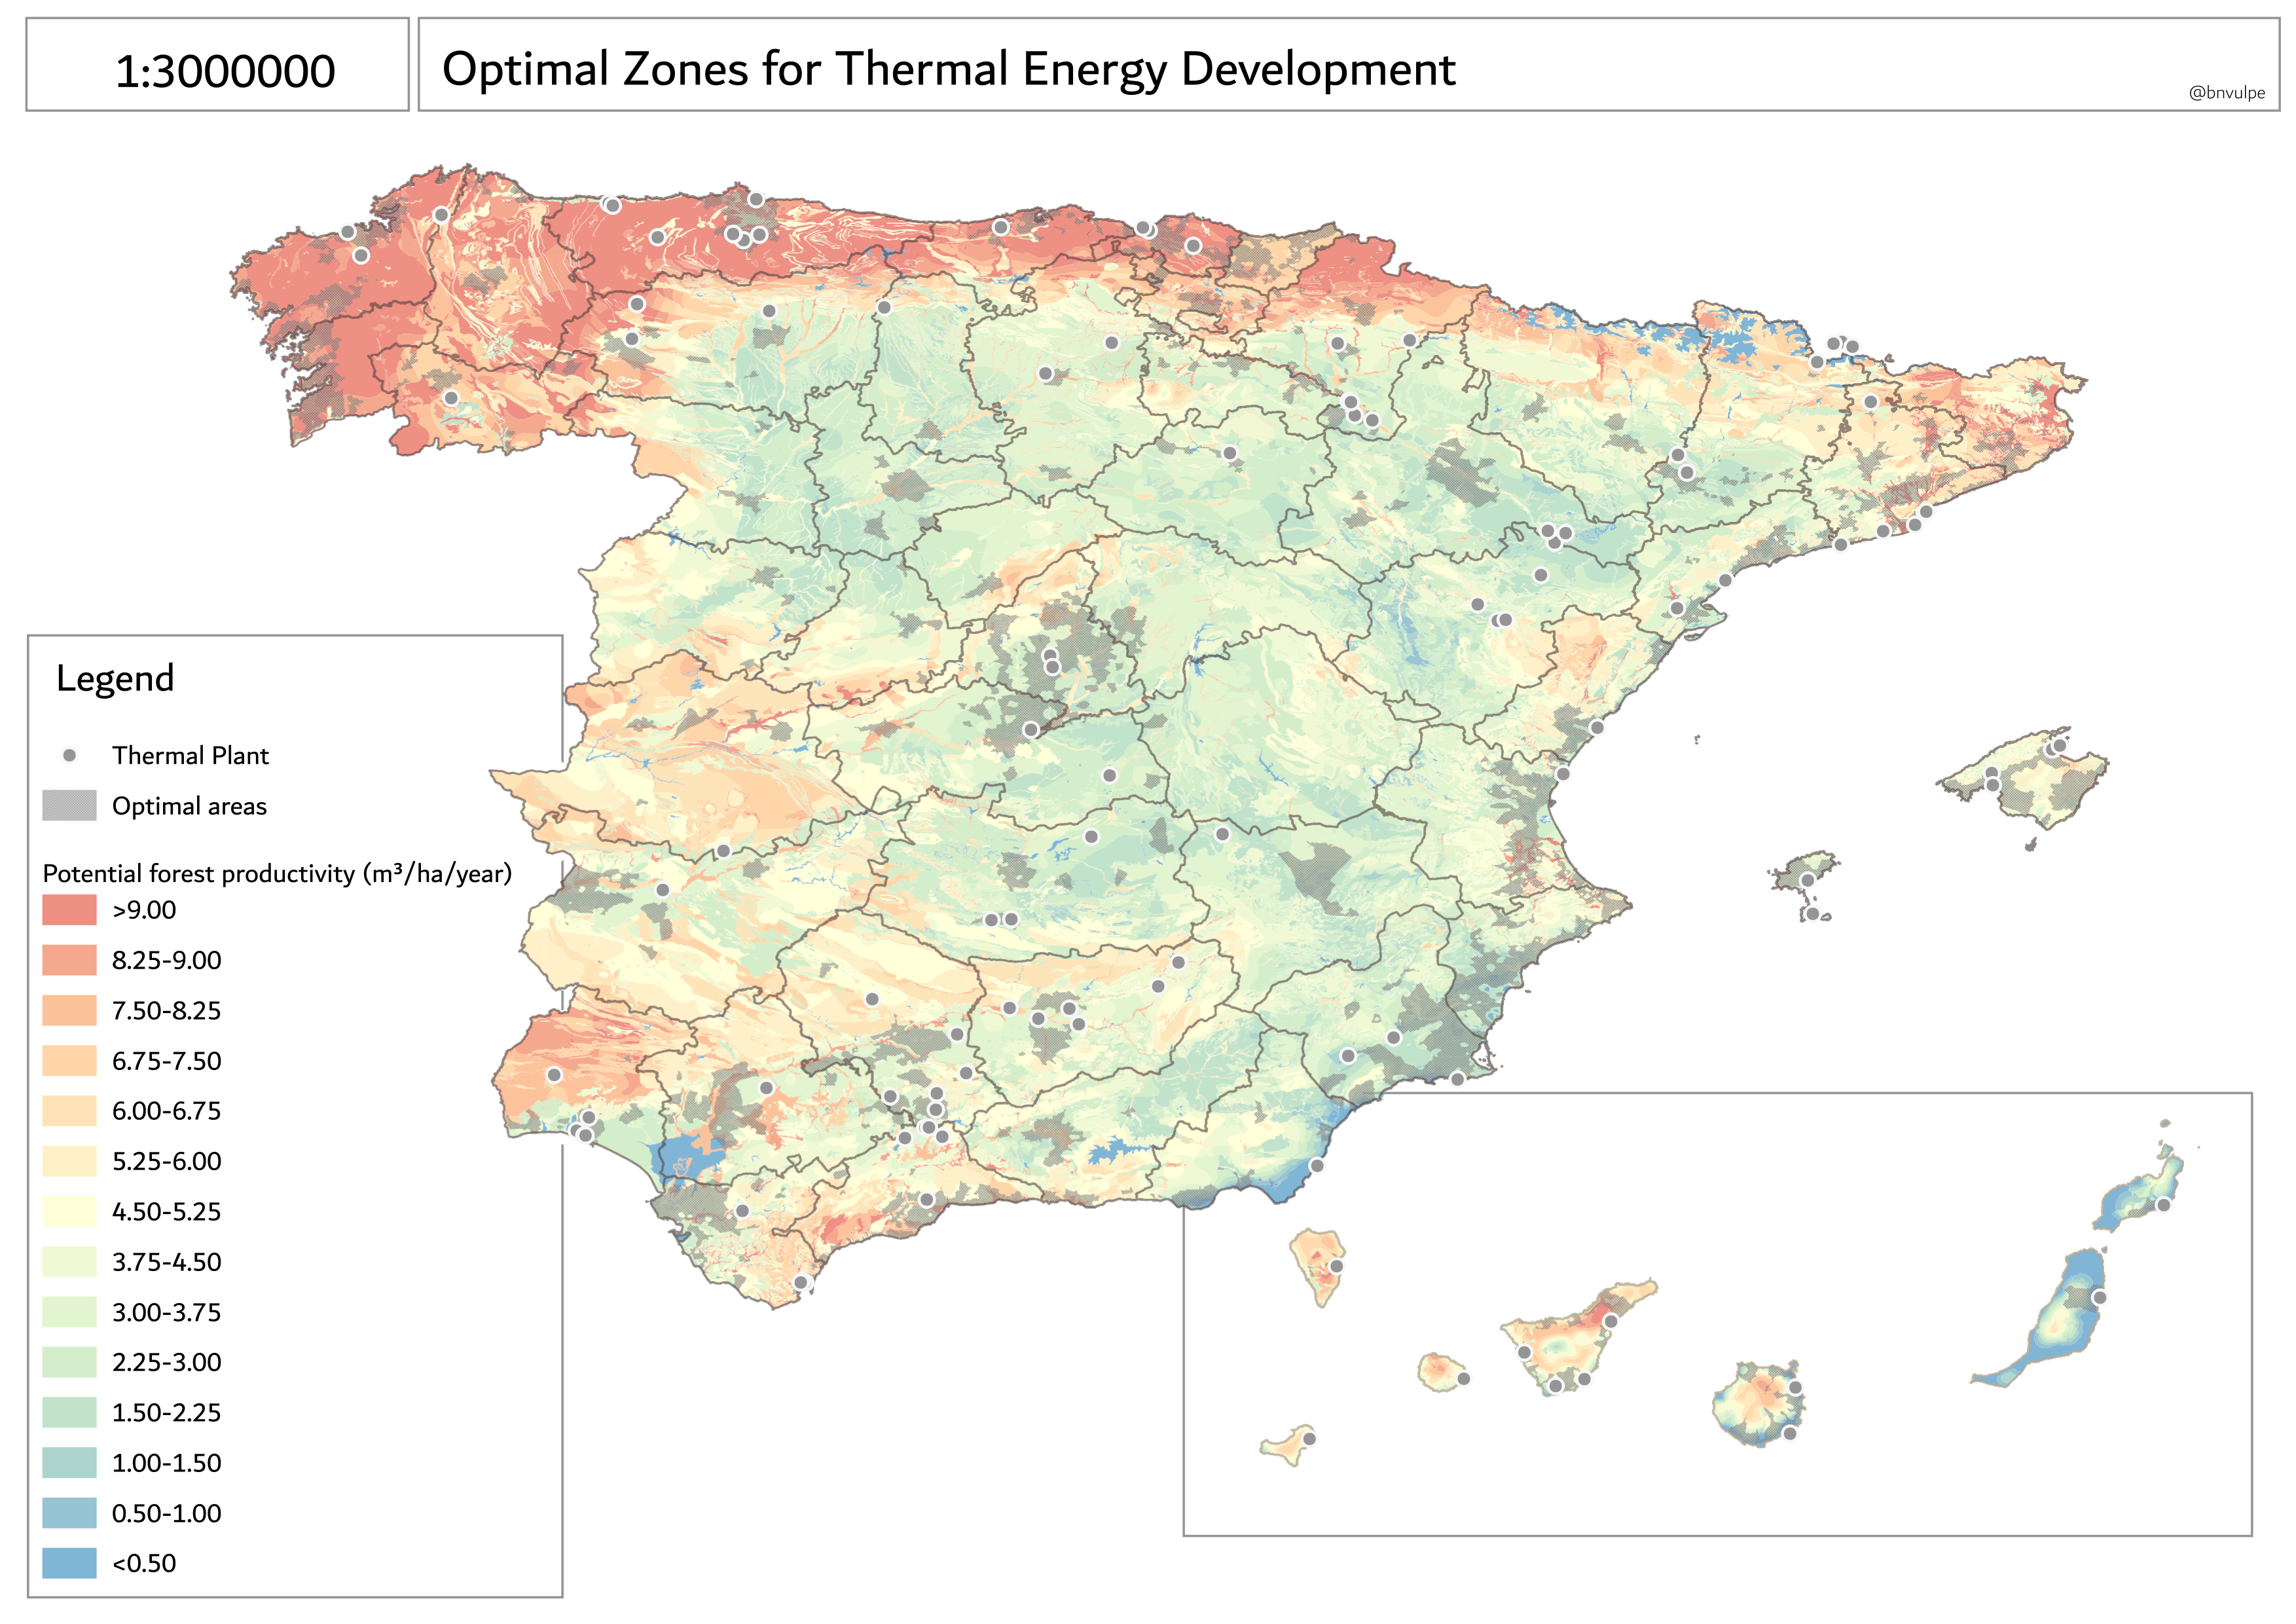
This map presents optimal zones for the use of thermal energy. Existing thermal power plants are also marked, though their low density means these areas were not excluded from the analysis. A raster layer of forest productivity potential is included in the background, enabling evaluation of overlap between optimal zones and regions with medium-high productivity. This intersection helps identify provinces with the highest viability for thermal development.
Optimal locations include western Pontevedra, central-western Lugo, western León, northern Cáceres, central Barcelona, southern Girona, central-western Granada, and eastern Valencia.
Solar Energy
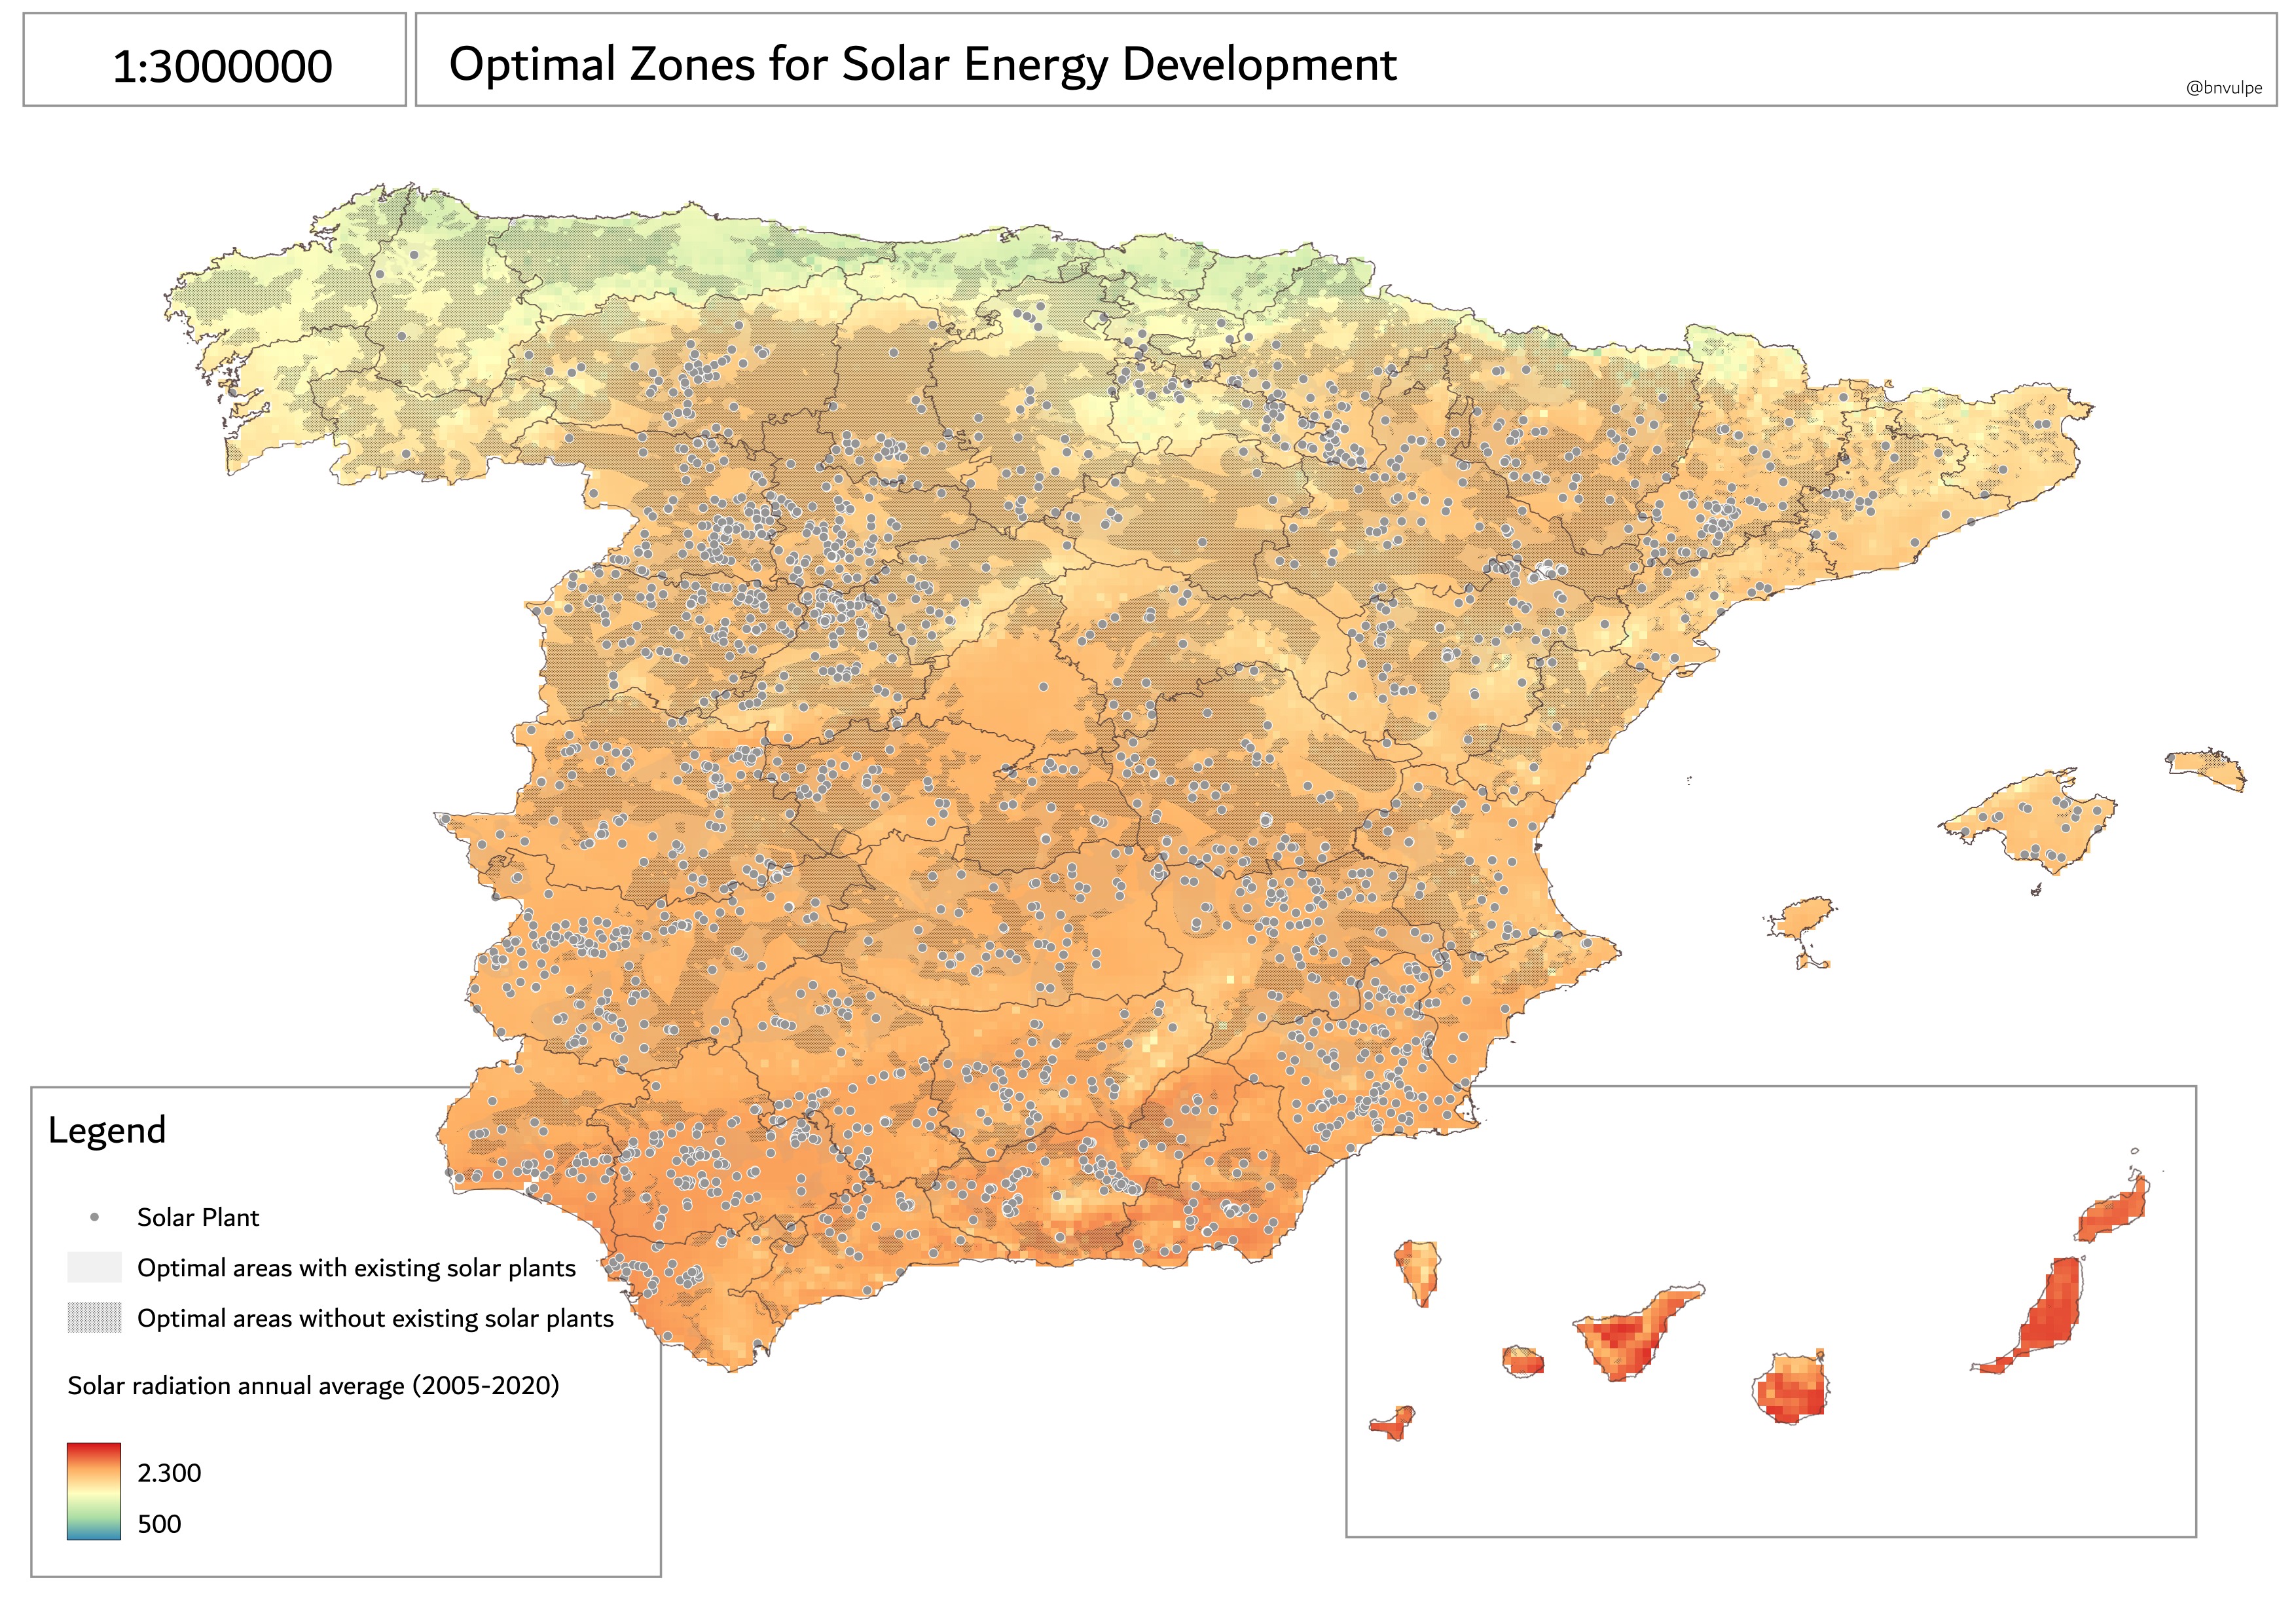
For solar energy, areas with existing solar plants are clearly distinguished from those yet to be exploited, with the aim of identifying expansion opportunities in high-potential regions. A raster layer showing average annual solar radiation is added. The intersection of this layer with previously identified optimal areas allows the localization of high-yield territories, organized by province.
Due to the current wide distribution of solar installations, priority areas have been identified in provinces with lower densities of existing sites. These areas include northern and southeastern Madrid, central and southern Soria, eastern León, central Palencia, central-northern Castellón, southwestern Salamanca, and southern Toledo.
Hydroelectric Energy
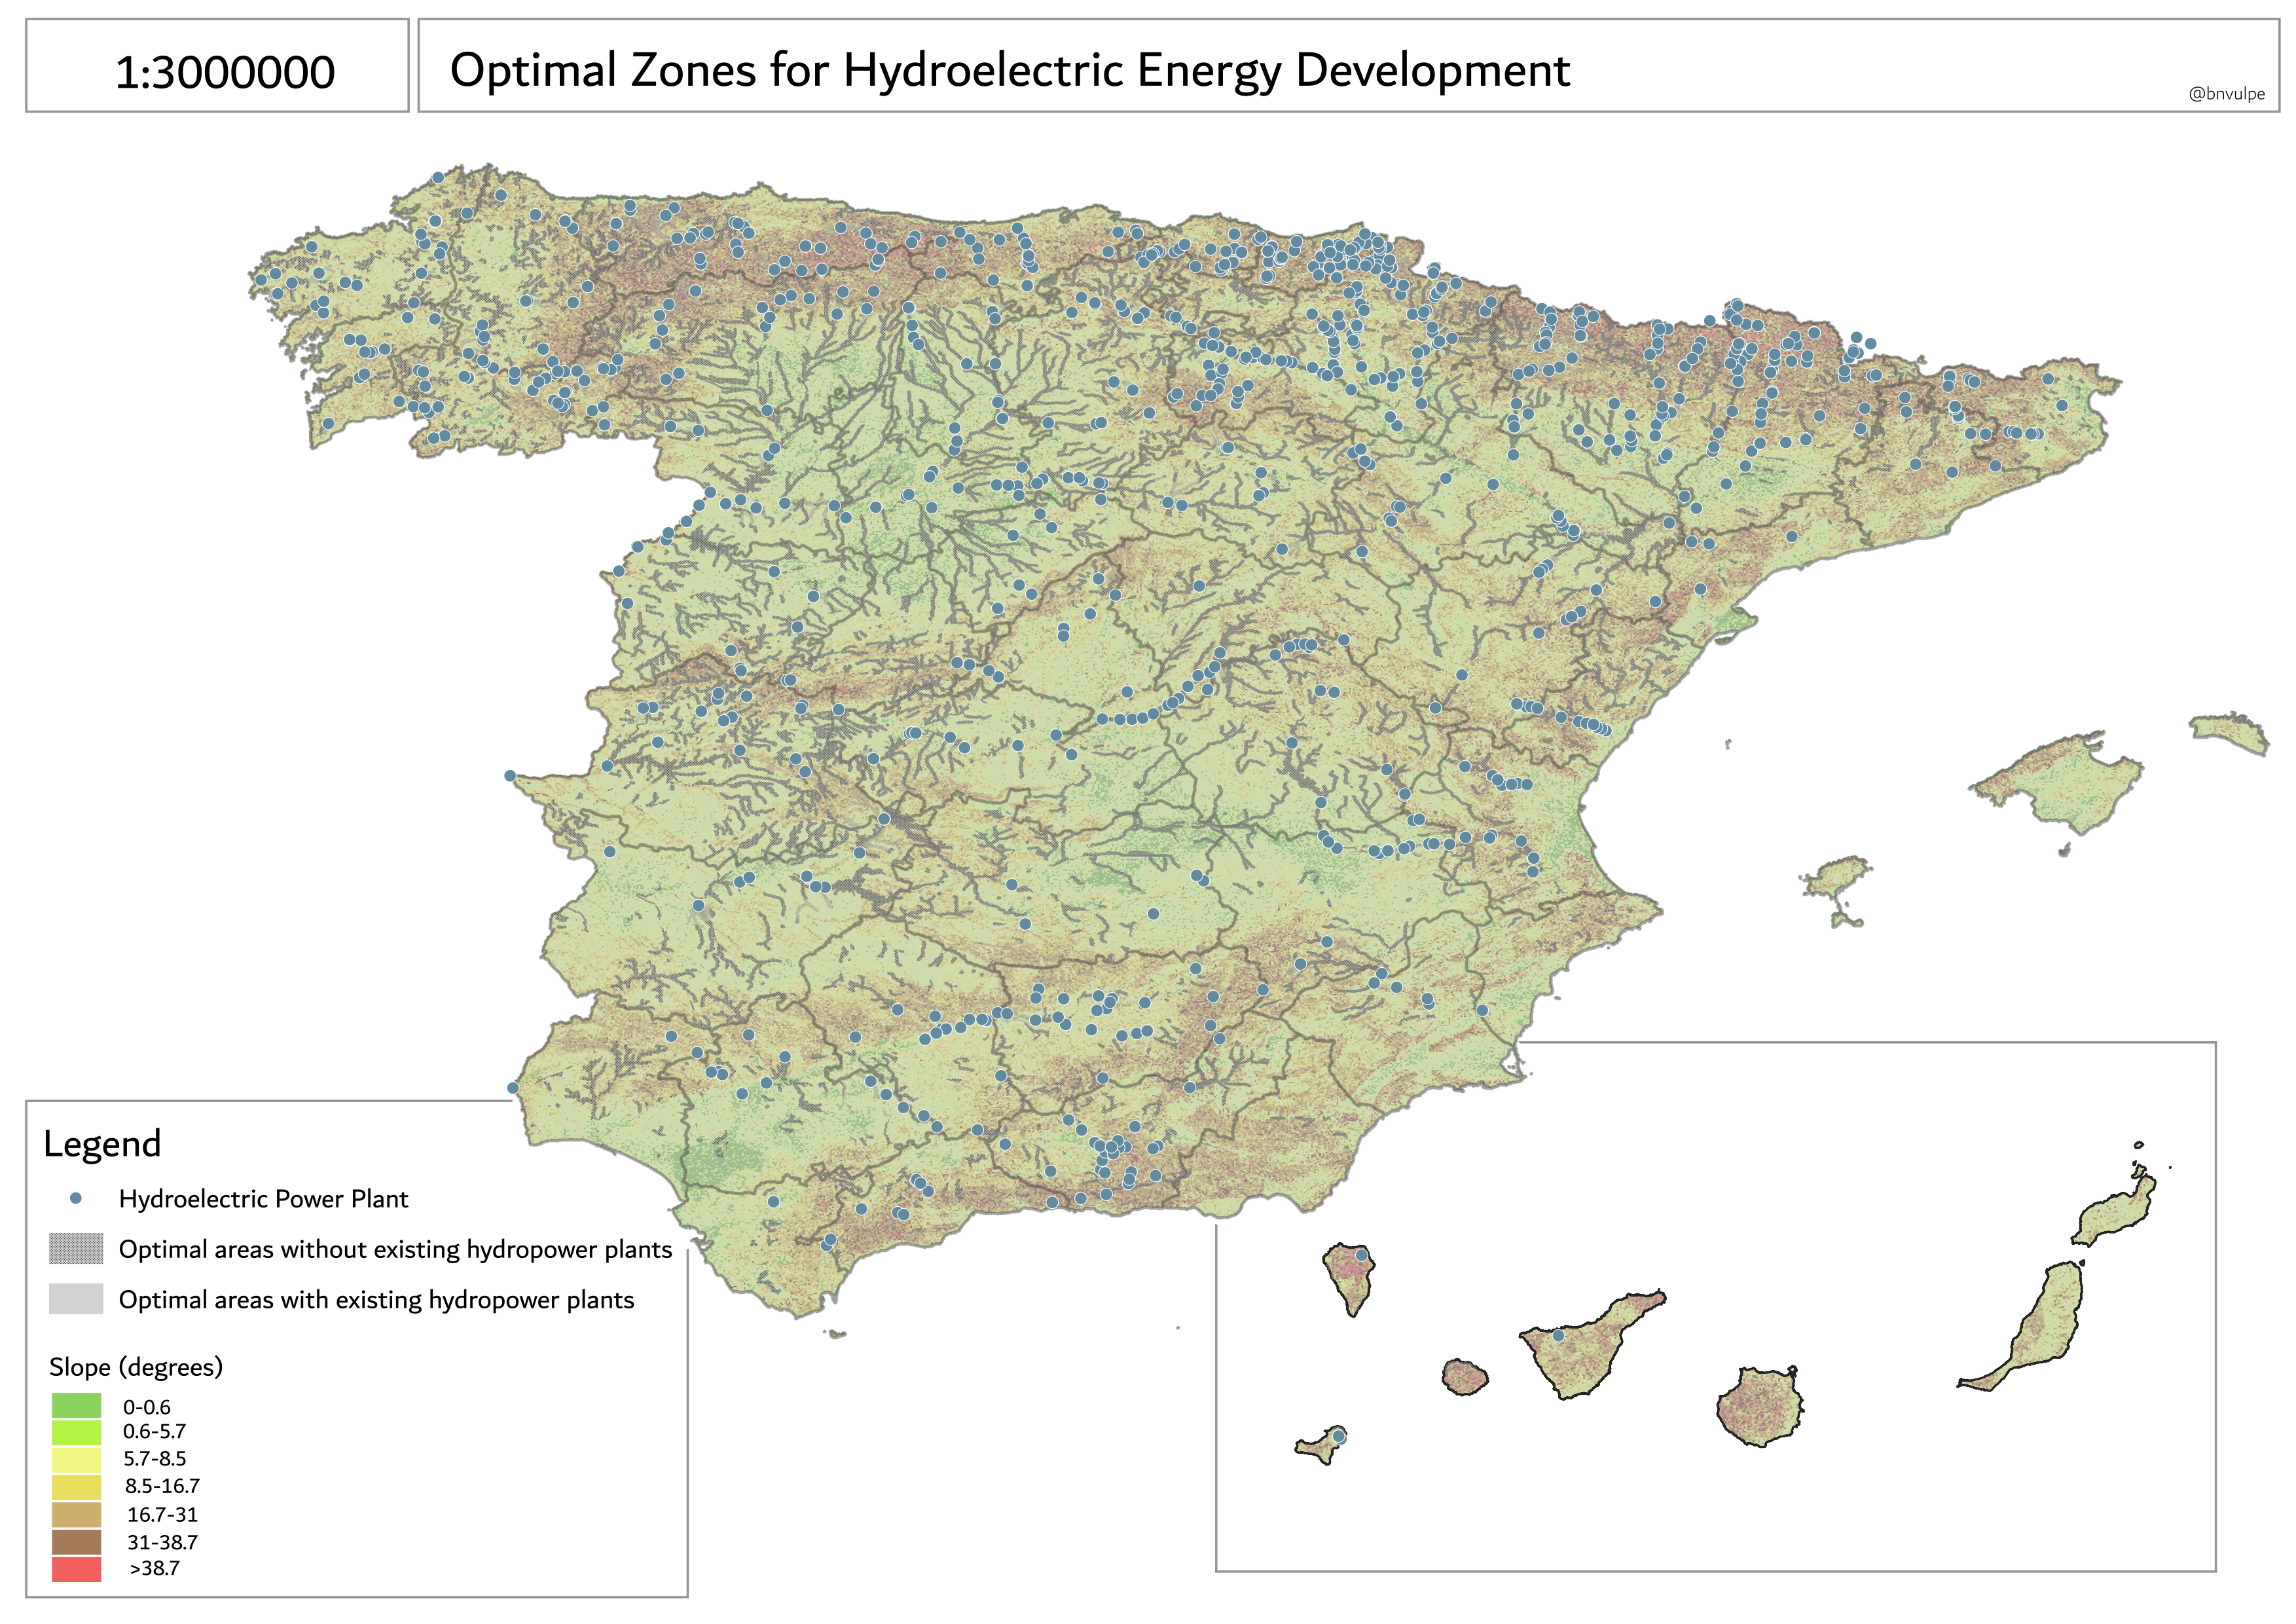
This final map shows optimal areas for hydroelectric energy development in Spain. As with the previous maps, regions with existing hydroelectric plants are distinguished from those without current infrastructure, highlighting potential expansion areas. A terrain elevation raster layer is included as background, as slope is a key factor for hydro energy utilization. The intersection of optimal areas with regions of medium-high elevation allows identification, by province, of sites with the highest hydroelectric potential.
Current facilities are generally well distributed in provinces with steeper terrain. However, additional opportunities for development are identified in northern Castellón, southern Ávila, and southern Badajoz.
Lastly, it is worth noting the correlation observed between the identified optimal areas and the current location of energy infrastructure, which validates and reinforces the reliability of the analysis.
Data Sources
| Type | Data Name | Date / Period | Source |
|---|---|---|---|
| Raster Layers | Average annual solar radiation (kWh/m²) | 2005–2020 | pvgis.com |
| Wind speed (m/s), annual average | 2025-05-23 | globalwindatlas.info | |
| Slope map of Spanish territory (WMS access) | 2024-09-30 | idee.es | |
| Vector Layers | BTN POI – Energy | 2025-02-10 | CNIG – BTN POI |
| Protected Natural Areas 2023 | 2024-12-31 | miteco.gob.es | |
| Electrical grid (BTN100) | 2015 | CNIG – BTN100 | |
| Population density and variation (2014–2023) | 2024-01-31 | miteco.gob.es | |
| Provincial boundaries | 2024-11-27 | CNIG – Boundaries | |
| Water bodies PHC 2022–2027 | 2023-09-25 | miteco.gob.es | |
| Rivers MDT 100x100 | 2007-01-01 | miteco.gob.es | |
| Potential forest productivity | 2020-10-26 | miteco.gob.es |
How Were These Areas Selected?
The methodology for selecting optimal development areas is explained below.
1. As a precautionary measure, a 1 km exclusion zone was applied around protected natural areas. Any zone within this buffer was automatically discarded to prevent impacts on ecologically valuable environments.
2. A 12 km positive influence area was defined around the national electrical grid, since proximity to existing infrastructure reduces connection costs and facilitates integration of new renewable facilities.
These two criteria were combined as follows:
- From the polygon representing the municipal boundary, areas overlapping with protected zones and their exclusion radius were removed.
- From the remaining area, only the portion within the electrical grid’s influence area was selected.
Thus, viable zones from both environmental and logistical standpoints were obtained within each municipality.
3. Population density was considered a key factor to minimize social conflict and adapt technologies to the local context:
- For solar, wind, and hydro energy, areas with fewer than 50 inhabitants per square kilometer were prioritized, targeting rural or sparsely populated areas where visual or acoustic impact would be lower.
- For renewable thermal energy, areas with more than 100 inhabitants per square kilometer were selected, as these technologies require constant heat demand, typically found in urban or peri-urban environments.
4. To identify new implementation opportunities, polygons already hosting the analyzed energy type were excluded.
5. Finally, a detailed analysis was conducted considering the technical requirements of each energy source:
- Hydroelectric energy: a spatial intersection was applied between selected municipalities and a 1 km buffer around rivers and water bodies, as these features are essential for hydroelectric use.
- Solar, wind, and thermal energy: specific raster variables were integrated, representing the most relevant natural resources:
- Solar radiation (solar PV)
- Wind speed (wind energy)
- Terrain slope (hydro and wind energy)
- Forest productivity (thermal/biomass)
All data, queries, and files related to this analysis, along with additional queries and visualizations, are available on GitHub.